
Write an essay based on the chart below.In your writing,you should(1)interpret the chart,and(2)give your comments.You should write about 150 words neatly on the ANSWER SHEET.(15 points)
题目
Write an essay based on the chart below.In your writing,you should(1)interpret the chart,and(2)give your comments.You should write about 150 words neatly on the ANSWER SHEET.(15 points)
相似考题
更多“Write an essay based on the chart below.In your writing,you should(1)interpret the chart,and(2)give your comments.You should write about 150 words neatly on the ANSWER SHEET.(15 points)”相关问题
-
第1题:
Directions: Study the following drawing carefully and write an essay in which you should
1) describe the drawing.
2) interpret its meaning, and.
3) support your view with examples. You should write about 200 words neatly on ANSWER SHEET 2.(20 points)
正确答案:
-
第2题:
Write an essay of 160-200 words based on the following picture.In your essay,you should(1)describe the picture briefly(2)interpret the meaning,and h(3)give your comments.You should write neatly on the ANS WER SHEET.(20 points) 答案:解析:In the picture above,in an unattended bookstore where there is no cashier and no staff,a customer is paying for the book he has chosen of his own free will.Such a bookstore is basically based on the customers'integrity.This illustration reveals the importance of integrity in todays society.cheif ieav-os onion,toona when no one is around There are many reasons why integrity is important Integrity means doing the right thing even when no one is around in our lives.First,living a life of integrity means that we never have to spend time or energy questioning ourselves.When we listen to our hearts and do the right thing,life becomes simple.Our actions are open to others,and we don't have to worry about hiding anything.What's more,when we have integrity,we gain the trust of others.We're dependable,and we become role models for others to follow when we hold ourselves accountable for our actions In our lives,we are going to be tested at one point or another by our integrity and ethics.Every time we do what we think is the right thing even though no one else sees us do it,we have taken a big step toward strengthening our integrity
 -
第3题:
Directions:Write an essay based on the chart below.In your writing,you should interpret the chart,and give your comments.You should write about 150 words on the ANSWER SHEET.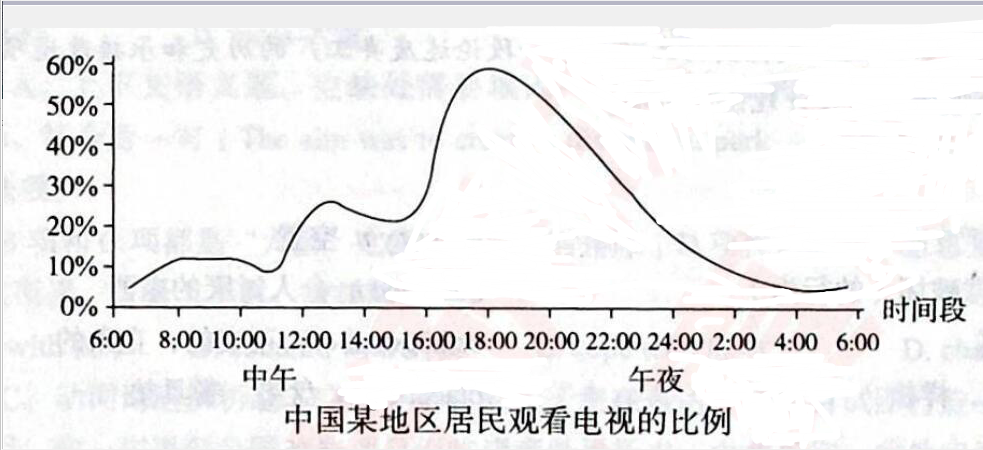 答案:解析:The line graph shows audience rating at different time.From the graph,it can be seen clearly that the number of TV audiences is on the rise from 6 a.m.At noon the number of audiences accounts for about 20%of the total population.At 6 p.m.,audience balloons to the peak of the day,reaching approximately 59%,and then the number ofTV audiences drops dramatically.There are several reasons leading to the trend of the audience rating.In the first place,traditional Chinese families would like to get together after dinner,watching news report or other entertainment programmes,therefore 6 p.m.witnesses the highest point of the whole day.Second,the drop of audience rating after 6 p.m.is partly due to the prevalence of Internet.There is a trend that more people resort to virtual space and computer games for entertainment at night.Third,since working people and students are occupied by theirjob sand study at daytime,only retired people and housewives are potential audience.Therefore,audience rating is in accordance with people's pace oflife.Internet has impacted TV audience to some extent.
 -
第4题:
In this section, you are asked to write an essay based on the following chart. In your writing, you should interpret the chart, and give your comments. You should write at least 150 words. Write your essay on the ANSWER SHEET 2.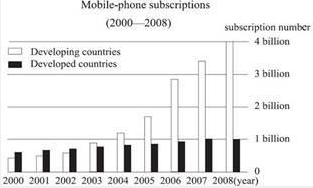 答案:解析:This bar chart shows mobilephone subscriptions in developing countries and developed countries,measured in billions,for the years 2000 to 2008.The mobilephone subscriptions in both developing countries and developed countries enjoyed increase in different speed over time.In this chart,the mobilephone subscription in developed countries maintained a continual and steady increase from 2000 to 2007 and remained constant in 2008.Meanwhile,the mobilephone subscription in developing countries have undergone a slow increase from 2000 to 2004 and then saw a great surge from 2005 to 2007.This trend increased to a peak about 4 billion in 2008.Based on different national situations,the reasons leading to this trend can be summarized into two points.First,the developed countries have a limited number of population,which decides that the demand for mobilephone service is also limited and will soon be saturated.Second,as for the developing countries,it has a large population and also a large demand for mobilephone service.And as the mobilephone becomes more available and more affordable,there is an increasing number of people buying their mobilephones.In my view,this trend that the number of mobilephone subscription continues to grow in developing countries will be constant for a while in the future.And this trend would also benefit most of the mobile users both in the developing countries and developed countries.
 -
第5题:
Write an essay based on the chart below.In your writing,you should interpret the chart,and give your comments.You should write about 150 words on the ANSWER SHEET.
 答案:解析:2019年12月21日下午,考研英语落下帷幕。纵观英语二试卷,总体来看比较容易。老师给大家解析一下英语二的大作文。本次英语二大作文考查的是饼状图,回顾过去英语二10年考试中,5年考查的是柱状图,3年考查的是饼状图,1年考查得失线形图,1年考查的是表格。可以看出柱状图和饼状图考查最频繁。本次考查的饼状图的话题仍然是关于大学生的话题。回顾过去10年考试中,有3年考查了与大学生有关的话题,分别是2013年考查大学生兼职情况,2016年考查某高校学生旅游目的调查,2019年考查某高校本科毕业生毕业去向统计。今年考查的是某高校学生使用手机的目的调查。本篇英语二大作文的结构要分三段来写:第一段描述图表,第二段分析原因,第三段给出结论、趋势预测及建议。第一段描述图表要观察全面,不可遗漏有用信息。其中用手机学习的占主要比例,占59.5%,可以用这个句型来写:…take(s)a lion’s share,accounting for 59.5%,其它用手机的目的是打发时间、浏览信息和其它,分别占到20.5%,17%和2%,这三者可以放在一起用一个句子来搞定,……occupy 20.5%,17%and 2%respectively。第二段分析原因,主要写这个现象的原因,尤其是用手机主要目的的成因。考生可以从这几个方面分析原因:第一,随着经济的发展,人民生活水平提高,几乎每个家长都会给学买一部手机,这一点是前提条件。第二,随着科技的进步,手机给人们带来了太多的便利,尤其是在学习、交流和查阅资料方面。第三段写结论、趋势预测和建议。结论可以概括一点,大学生这样利用手机很符合年轻人的特点与时代特征。趋势预测大概说明一下未来几年这边趋势会发生怎样的变化,一般而言图表中的现象都可以体现出未来一段时间会继续持续一段时间。最后,可以提示年轻人不要沉迷于手机。综上,今年的英语二大作文还是比较容易写出,具体写法请看下面的参考范文:答案:一段:As is apparently demonstrated in the chart above,we are informed some information concerning college students’reading intentions with mobile phones in a certain university.To be more specific,with the help of cell phones,the proportions of college students’spending on study take a lion’s share,accounting for up to 59.5%.Then those who would like to spend more time on goofing,browsing information and others occupy approximately 20%,17%and 2%respectively.二段:There are diverse components contributing to the above trend,but generally speaking,they may put down to the following two aspects.Initially,there is no doubt that recent years have witnessed the rapid development of economy,and people’s living standards have been improved remarkably,as a result of which,an increasing number of parents are likely to buy their children a smart phone,which may provide possibility for students to apply more advanced equipment into study,to the extent that their learning efficiency and reading horizons would be improved.Simultaneously,along with the development of technology and the advancement of the Internet,a growing quantity of college students’reading habits have been changed because mobile phones would offer more convenience during their study,which should be taken into account.三段:Based on the discussion above,a conclusion can be drawn safely that college students’reading habits adhere to youngsters’characteristics and comply with the trait of the new era.Given the data above,it is well predicted that this trend as reflected by the pie chart above will continue for a while in the near future.Nevertheless,there are also some potential risks if college students are too addicted to mobile phones;therefore,it is advisable for youngsters to arrange time reasonably during using cell phones.
 -
第6题:
Directions:Write an essay based on the following table.In your writing,you should interpret the table,and give your comments.You should write about 150 words on the ANSWER SHEET.
 答案:解析:The table shows that the income sources of Chinese students are quite different from those of American students.In China,85%of students'money is from their parents while in America only 40%ofstudents'money is provided by their parents.Chinese students earn only 5%from part-timc jobs and 5%from student loan.However,American students got 20%and 25%of their money from these two sources respectively.In addition,fellowship or scholarship takes up 15%of American students'income while income from this source for Chinese students occupies only 5%.There are probably two reasons contributing to the differences.First,in China,students without sustainable income are still considered dependent on parents.Therefore,it is natural for them to ask their parents for money.By contrast,American students over 18 years have developed more senses of financial independence.Second,since America is more developed than China,it is relatively easier for American students to find part-time jobs.Therefore,a larger proportion of income comes from part-time job in America.I believe in future,more Chinese students will realize the necessity of self-dependence and try to make their own Iiving through part-timejobs and other ways.
 -
第7题:
Write an essay hased on che chart below.In your writing,you should interpret the chart,and give your comments.You should write about 150 words neatly on the ANSWER SHEET.
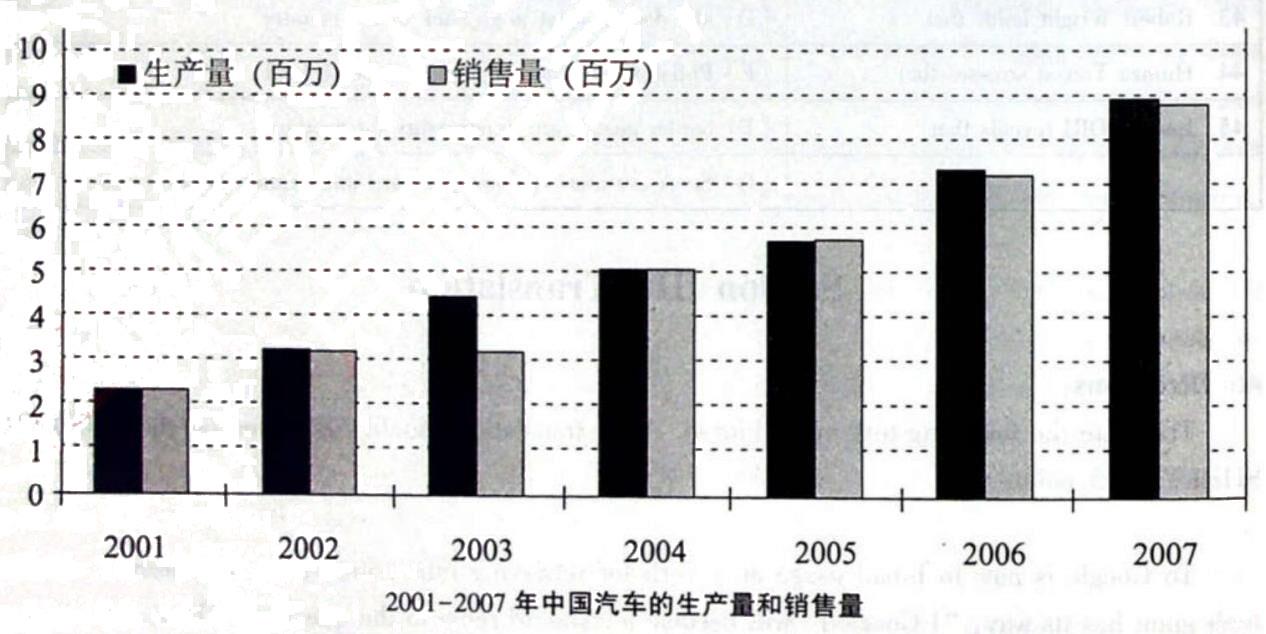 答案:解析:Chin8 s Automobile Market Grows Rapidly According to the table above,the auiomobile production sales in China amounted to over 8 million in 2007,with an average annual growth of more than 22qo from 2001 t0 2007.This means that after less tban one decade of development,China has emerged into the world's fastesl-growing major auto market.There are two main reasons for the increase.For one thing,since general market-onented reforms were introduced in China around 30 years ago.restrictions and controls on the automobile sector have been gradually eased,resulting in the joint venture partnerships with major global automobile manufacturers.For another,thanks to Lhe burgeoning economy,the disposable income of Chinese cithens has maintained an upward trend for years,contributing to an increasing number of people owning private vehicles.Despite the breakneck growth over the past decade,China's auto market still has much room Lo grow before reaching saturation and the prospects for China's auto market remain bright.
 -
第8题:
Wriie an essay based on the chart below.In your writing,you should interpret the chart,and give your comments.You should write about 150 words neatly on the ANSWER SHEET.
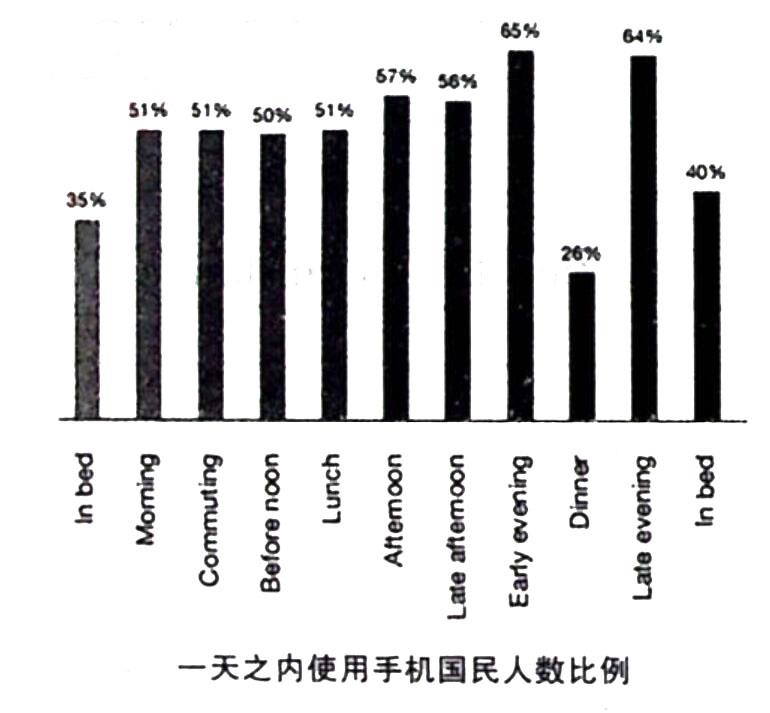 答案:解析:According to the chart above,people are checking their phones as soon as they wake up(51%),on their way Lo work(51%),at lunch(51%),in the evening(65%,64%),and even in bed(35%,40%).This indicales that the majoriLy of Chinese people are using their smartphones mainly in the evening,when they are back trom work and want to relax.It mighl seem like a perfect opportunity to check your email,play a video game,see what your friends are up to on social media or check tomorrow's weather forecast in the evening.However,ac-cording to relevant studies.smartphones are almost perfectly designed to disrupt sleep,because they keep us mentally engaged late into the evening.causing us Lo sleep a lot later than we ideally should.What's more,people who are on their phones after 9 p.m.are notably more tired and less productive the next day compared with their unplugged counterparts.Therefore,it is recommended that we should place our smartphone on the other side of the room and then get into bed with a good book when we are getting ready to sleep.
 -
第9题:
Write an essay based on the following chart.In your writing,you should 1)interpret the chart and 2)give your comments.You should write at least 150 words Write your essay on ANSWER SHEET 2.
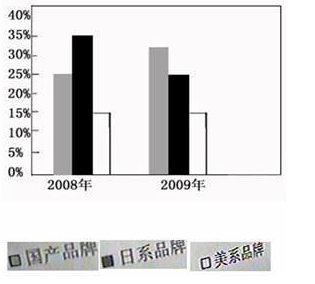 答案:解析:This bar chart shows the market shares of three different types of brandcars in domestic automobile market between 2008 and 2009.In 2008,Japanese brands cars took the lead in the automobile market,accounting for 35%,followed by Chinese brand cars,with 25%marketshares.American brand cars fell behind,with mere 12%market shares.In2009,Chinese brand cars saw a mild increase in their market shares,whichcame to 33%,while Japanese brand cars lost a lots of their market shares,taking up only 25%.American brand cars stayed almost the same position,occupying 13%market shares.It could be concluded that more and more people choose to buy Chinesecars instead of buying the foreign brands cars.In the past,Japanese carsdominated the Chinese car market because of the comparably low priceand low oil consumption.While,as our Chinese car industry has grown tobe maturer and maturer.We could also produce cars with highperformance,low price,and beautiful look.However,it cannot beneglected that the gap is not so obvious and if Chinese brand automakerswant to make a big difference,they have to make more efforts.
 -
第10题:
Write an essay based on the following chart.you should interpret the chart and give your comments.You should write about 150 words on the ANSWER SHEET.
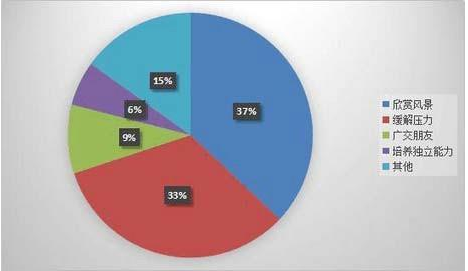 答案:解析:Portrayed in the above pie chart is a survey of college students'purposes of traveling。The number of students who take traveling as a chance to see beautiful scenes accounts for 37%,while students who would like to travell relieve pressure fr om study.
 -
第11题:
Write an essay based on the chart below,In your writing,you should interpret the chart,and give your comments.You should write about 150 words on the ANSWER SHEET.
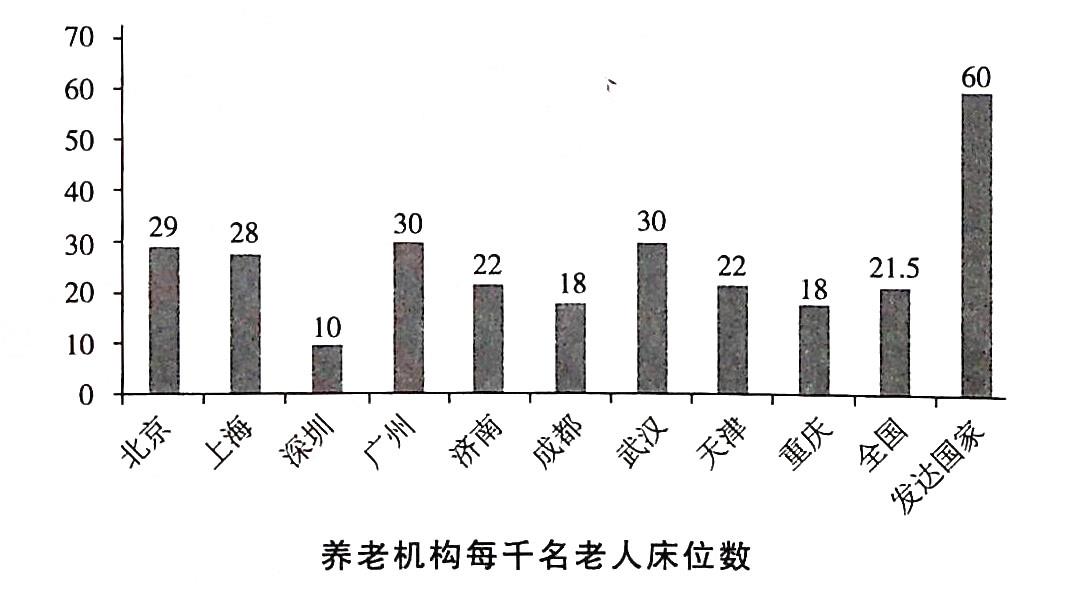 答案:解析:From the chart above.we can see the numbers of beds per thou.sand older people in elder-care institutions of some Chinese cities and the developed countries.Though the numbers for some cities,such as Guangzhou,Wuhan and Beijing,are higher than the average number for the whole country,which is 21.5,they are st川much lower than that of developed countries,which is 60.There are many factors contributing to the above-meniioned phenomenon,but in general,they may come down to two major ones.To begin with,the tradition of supporting the elders at home in China has hindered the development of nursing institutions.What's more,while the aging of the population is speeding up,the attention placed on the elders is insufficient.Considering the big gap between China and the developed countries,it is high time for us to take measures to close the gap.First,we.should change our idea that nursing institutions are only for those whose children don't respect them.In addition,more funds should be invested for the construction of elder-care institutions.Only in this way can we construct a society in which the elderly are looked after properly.
 -
第12题:
Directions:Write an essay based on the following chart.In your writing,you should interpret the chart,and You should write about 150 words on the ANSWER SHEET.
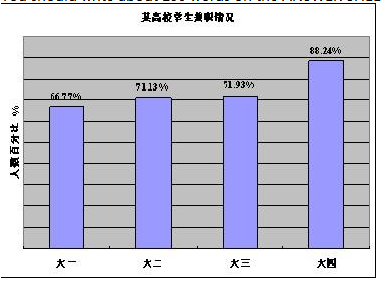 答案:解析:The bar chart shows the general trend of university students whotake parttime jobs at different stages during their college life.Seeing from the chart,more than half of the college students,about 66.77%take a parttime job at their first year.And the proportion increases slightly year by year,til the last year,the proportion reaches the maximal number,surging to 88.24%.There are basically three reasons behind this trend.To begin with,most students are eager to take a parttime job in the purpose of earning some money,which can ease their parents'burden.Besides,they can acquire more experience before officially entering the society.And with more experience,they can easily get a job compared to those who do not have any experience.Finally,they can not only turn what they have learnt into the application,but also learn more which they cannot obtain from their books.In my view,getting a parttime job is a good practice.However,the major task of students is still the study.They should make a balance between their academic life and their working life.
 -
第13题:
Write an essay of 160-200 words based on the following picture.In your essay,you should(1)describe the picture briefly(2)interpret the meaning,and(3)give your comments You should write neatly on the ANSWER SHEET.(20 points)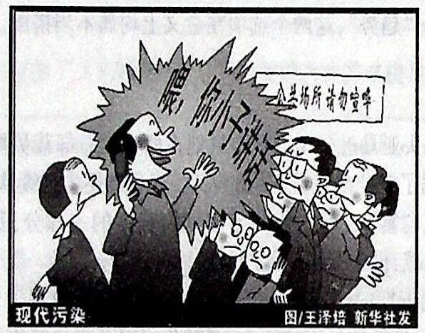 答案:解析:In the picture above,a man is talking on his phone loudly in a public place,being deliberately ignorant of other people's aversion to him within the same enclosed area.This illustration tries to point out the public cell phone behavior Public places,such as libraries,hospitals,galleries and theaters,are usually expected to be quiet and peaceful ne uses of mobile phones in such places are likely to disrupt the desirable working environment For instance.in a library,where people are pondering over the books,the constant mobile ringtones or the phone conversation will be intru-sive or irritating.Mobile phone usage in public places like hospitals can easily interfere with the medical equipment which can be harmful to the patient.Moreover,the environment at shopping malls,stores and other public places is very noisy and talking over cell phones will add extra decibel.Apart from that,using mobile phones in music galleries or theaters can result in others'discomfort and spoil their entertainment In my opinion,cell phones should be allowed in public places with some restrictions.What's more,in public places,quiet zones where phone use is banned should be set up.
 -
第14题:
Write an essay of 160-200 words based on the following picture.In your essay,you should(1)describe the picture briefly(2)interpret the meaning,and(3)give your comments.You should write neatly on the ANSWER SHEET.(20 points)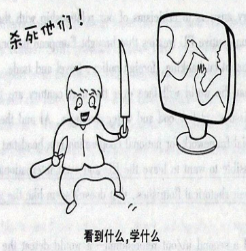 答案:解析:On Media Violence According to the picture above,a boy is imitating what he has seen on a television program,taking a knife on one hand,and a stick with another,saying"kill them all!"What this illustration tries to reveal is the devastating effects of electronic media violent program on young people Everything that children see or hear in the media early on in their lives affects them in nowadays,it's virtually impossible to keep kids in a violence-free bubble.Over sixty percent of television shows being shown in prime time contain some form of violence.Current research shows that violent media is associated with aggressive behavior.Children who view media violence are more likely to have more feelings of hostility and less remorse for consequences Violent situations are all too common in everyday entertainment and there are far fewer non-violent programming choices.Therefore,parents should monitor and be more attentive to their children.They need to pay more attention to their childrens lives and not let them sit in front of the television,whether it is for movies,video games,or general television shows
 -
第15题:
Write an essay based on the following chart.In your writing,You should interpret the chart,and give your comments.You should write about 150 words on the ANSWER SHEET.
 答案:解析:From the graph,we can clearly witness that the urban population was ascending while the rural population was declining during 1990 to 2010.The number of the urban citizens rose from 300 million in 1990 to about 460 million in 2000,and to about 685 million in 2010,while the rural peopledescended from about 820 million in 1990 to 800 million in 2000 and to 690million in 2010.It's apparent that in the past two decades,the urbanpopulation witnessed a steady growth,but in the latter decade,the rural population had a remarkable shrinkage.Personally,there are two main reasons for this phenomenon.On one hand,the economic boom led to the regular improvement of people sliving standard,and further resulted in a steady growing urban labor force.On the other hand,from 2000 the countryside urbanization oriented by the government gave rise to a conspicuously declining of rural labor force.In conclusion,based on the analysis above,the increase of urban quantity of citizen will be going on,while the rural population will continue to drop in the future,which is the need and trend of china's urbanization process.
 -
第16题:
Directions:Write an essay based on the chart below.In your writing,you should 1)interpret the chart,and 2)give your comments.You should write about 150 words on the ANSWER SHEET. 答案:解析:The pie chart given above reflects the public's attitude towards food safety.According to the figures,44.7%of the people take neutral attitude towards food safety,ranking first.The percentage of consumers being a little worried about food safety ranks the third among all.making up t 5.8%.There is no denying that food safety is related to people's health and basic livelihood.However,many producers tend to adopt poor-quality raw materials to lower costs,resulting in poor-quality products prevailing in our society,which not only poses threats to people's health,bul also wreaks havoc(破坏)on the economic development and social stability.Particularly,when the authorities concerned fail to give direct control and supervision,these profit-driven companies are unlikely to shoulder social responsibility.To conclude,such a trend will probably develop more dramatically in the future.Therefore,it is advised that administrators and the authorities should keep taking measures to reverse such trend,and it is only by consistent and persistent efforts that they can ultimately eliminate the misdeeds.
 -
第17题:
Directions:Write an essay based on the chart below.In your writing you should interpret the chart,and give your comments You should write about 150 words on the ANSWER SHEET.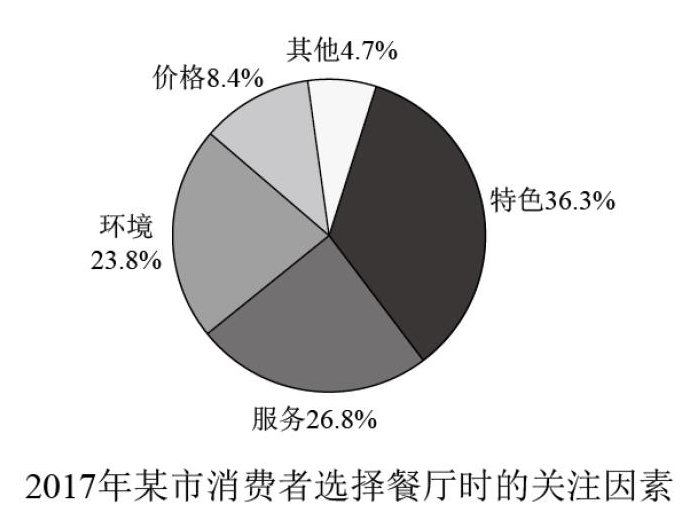 答案:解析:The pie chart above evidently ilustrates various target elements in terms of consumers'choosing restaurants in a certain city in 2017.To be specific.distinguishing feature took a lion's share,accounting for approximately 36.3%.While service and surr
 -
第18题:
Write an essay based on the following chart.In your writing,you should linterpret the chart,and give your comments.You should write about 150 words on the ANSWER SHEET. 答案:解析:The chart shows that when choosing online courses./19%citizens pick career training course.s.24%citizens decide to learn useful extracurricular knowledge,18%seek afier-class instruction and 6%choose other courses.Only 3%citizen.s take literature and art courses.Hence we can see,citizens mosLly take online courses to imIJrove skills and supplement their knowledge.This suggesis that in this era of knowleclge explosion.the traditional rormai schooiing is inadequate,and more convenient and flexible online education woulcl be a good complement.This phenomenon also reflects citizcns'limiied mindset with regard to online courses-thcy mostly perceive online courses as an investment or a commocliiy and seek immecliaLe returns,so they focus more on career training ancl extracurricular instructions in funclamental eclucation,noi realizing that online courses can also provide an insight into culture zind art that grcatly benefits inclividuals'long-term clcvelopment.As the online cducaiion represents the future of education.instcacl of diminishing online courses into the funciional"online training",we.should use them to access to culture ancl arr,and thus cultivate our mind.Only by doing so.can we reach a comprehensive cevclopment.
 -
第19题:
Write an essay based on the chart below.In your writing,you should interpret the chart,and give your comments.You should write about 150 words neatly on the ANSWER SHEET.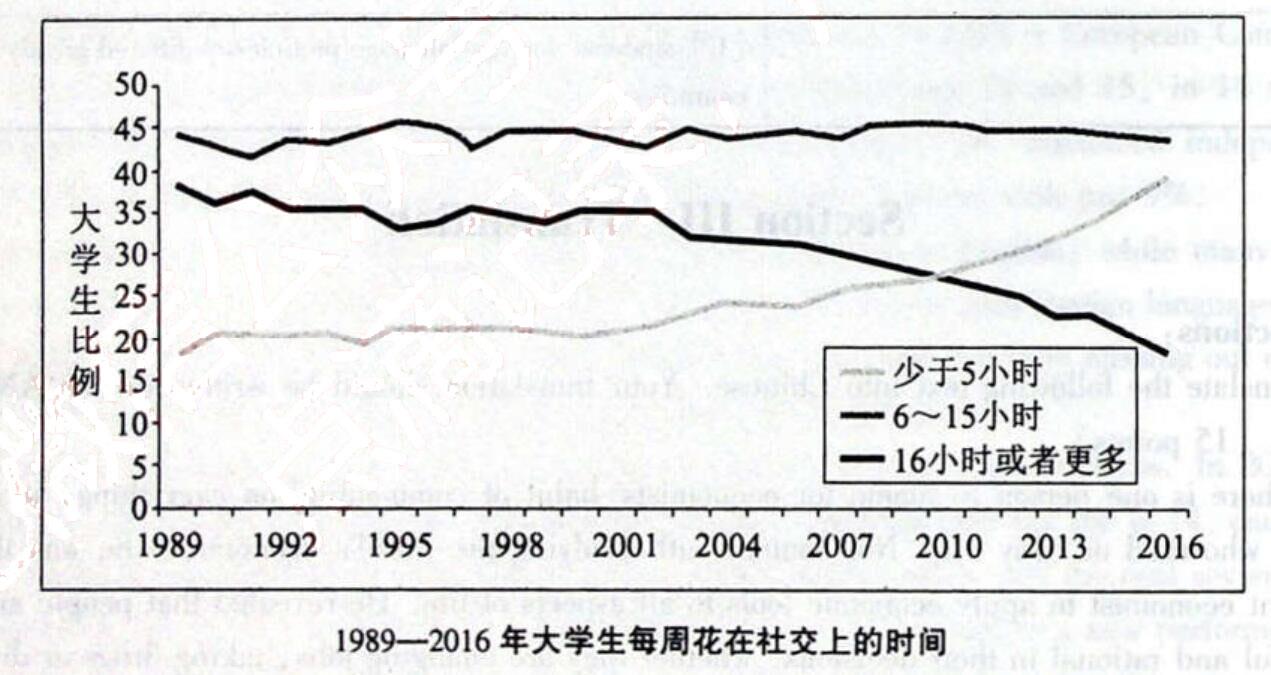 答案:解析:College Students Spend Less Time Socializing with Friends According to the table above,in 1989,37.9%of freshmen said they spent at least 16 hours a week hanging out with their friends,while 18.lc/o said they spent five hours or less.But in 2016,only 18%of freshmen said they spent at least 16 hours a week socializing,while 38.8qo stud they spent five hours or less.This means that college freshmen a他spending less time with fnends than ever.Two main reasons can help explain this phenomenon.For one Lhing,young adults are focusing more on getting good grades now as colleges become more demanding and selective as compared to 1989.Thus with the pressures of doing well in school,students have less time to socialize and instead learn to put their education first at all times.For another,some university studenis traded some of the hours they would nonnally have spent hanging out with friends or partying for time on so-cial media.Even though socializing with friends has declined,students increasingly value institutional social offerings and environments on campus.This may indicate that students are increasingly looking to institutions to pravide social opportunities given their declininf;experience with less structured forms of socializing.
 -
第20题:
Write an essay based on the following chari.In your writing,you should interpret the chart.and give your comments.You should write about 150 words on the ANSWER SHEET
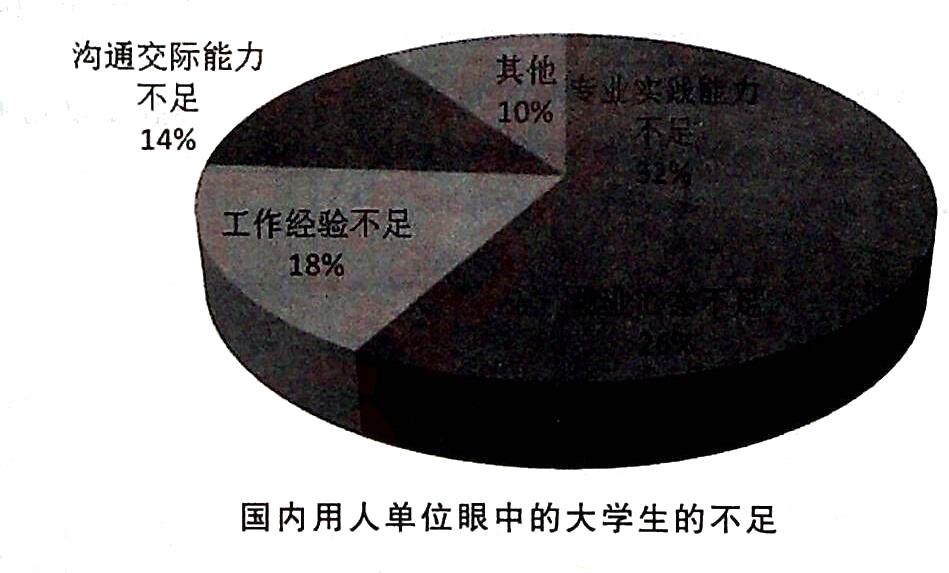 答案:解析:The above pie chart illuminates the shortcomings of fresh graduates as perceived by employers.As is clemonstrated in the diagram,up 10 32%of employers lament gracluates'lack of ability to solve practical professional problems,next comes the concern over graduates'unreacliness to work,accounting for 26%.In an increasingly competitive job market,a good degree could no longer guarantee a decent job.Today's employers are putting increasing emphasis on candidates'problem-solving skills and the correct mindset to get a job which are unforiunately found missing from most young graduates.College students usually dedicate time and effort to theoretical knowledge while seldom engage in work-related learning activities.Moreover,few students have iclentified their career paths by the time they leave university.They prioritize salary over everything else and hold unrealisitic expectations.To assure smooth integration into professional life,and hence into society,students need to equip themselves with a battery of professional practical skills and develop a career plan aligned with their abilities and interests instead of continuing to moan about the lack of employment opportunities.
 -
第21题:
Write an essay based on the following table.In your writing,you should describe the table,and give your comments.You should write at least 150 words.You should write at least 150 words.
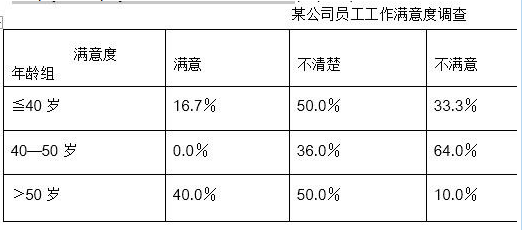 答案:解析:This table ilustrates the difference of degree of satisfaction among employees at different ages in some company.In general,the overall trend of the degree of satisfaction is different with the variation of ages.Of those who feel satisfactory about their jobs,those beyond 50 years old take up the majority,accounting for 40%,followed by those who are no more than 40 years old,which take up 16.7%.Those between 41 to 50 years old have the lowest satisfactory rate,merely0.0%.Of those who feel dissatisfactory about their jobs,those between 41 to 50 years old take up the majority,accounting for 64.0%,followed by those less than 40 years old,which take up 33.3%.Those who beyond 50years old enjoy the lowest dissatisfactory rate,taking up only 10%.Besides,there are still 50.0%of less than 40 years old employees,36.0%of those between 41 to 50 years old and 50.0%of over 50 years old employees remaining uncertain about the degree of satisfaction.The contributory factors to this result can mainly divide into three parts.Firstly,those less than 40 years old are ambitious,impractical and eager to find their places in work.With those characteristics,they often get upset find their places in work.With those characteristics,they often get upset when they fail to fulfill their goals.Secondly,those between 41 to 50 years old employees,confronted with challenges posed by their young colleagues,often face a great deal of working competition and pressure.Lastly,with their impending retirement,those beyond 50 years old face relatively small working pressure and feel satisfactory about their jobs.From this table,we can make a conclusion that if the companies want to raise the degree of satisfaction of its employees,it should make more efforts to improve the working environment,ameliorate the welfare and establish the effective incentive mechanism.
 -
第22题:
Write an essay based on the chart below.In your writing,you should inlerpret the chart,and give your comments.You should write about 150 words neady on the ANSWER SHEET. 答案:解析:China Outpaced North America in Box office Growth As is indicated in the graph,from 2005 t0 2010,China's theatrical revenue increased at a compound annual rate of 34%;from 20JI t0 2015,the pace quickened t0 43%per year.So far in 2016,China's movie revenue has increased 51qo,and there's no sign of a slowdown.In contrast,North America's theatrical business has been growing;at an annual rate of just over l%since 2005.There are two main factors driving this incredible growth.First,China is undergoing the largest and most rapid expansion of middle class in human history.Hundreds of millions of people are moving up to have fun.Secondly,cinema construction is booming.Every year,thousands of new cinemas are opening,providing millions of potential customers with the opportunity of enjoying the moviegoing experience in modem muIliplexes.Things will evenlually have to cool off,but with so many big cities still lacking multiplexes,it will be many yetus before China reaches a saturation point.
 -
第23题:
Write an essay based on the chart below.In your writing,you should interpret the chart,andgive your comments.You should write about 150 words on the ANSWER SHEET.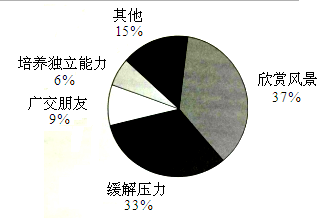 答案:解析:As can be seen from this pie chart,students travelling to enjoy the beautiful scenery account for the biggest proportion and reach 37%.33%students take a trip for the purpose of relieving pressure.Only 9%students are to make friends and another 6%are to nurture their independence.And the remaining 15%students travel for other purposes.There are two factors responsible for this phenomenon.To begin with,with the improvement of our living standard,the once-deemed-expensive traveling has become affordable to students.(2)In addition,the increasingly heavy pressure from study and life has made it necessary for students to take a trip to relax themselves.As far as I am concerned,this phenomenon(4)is not the single case,and the structure of travelling purposes needs adjustment.Besides enjoying the landscape,students should make full use of their trips to associate with a wider range of friends and to foster their independence and interpersonal skills.Only in this way can they benefit more from their trips.